top of page
PROBLEMS I SOLVE
Revenue problems rarely begin where they show up.
Missed forecasts, stalled pipeline, uneven territories, and retention risk are usually symptoms. I trace them back to the signal, decision, process, or system that is actually breaking.
DOES THIS SOUND FAMILIAR?
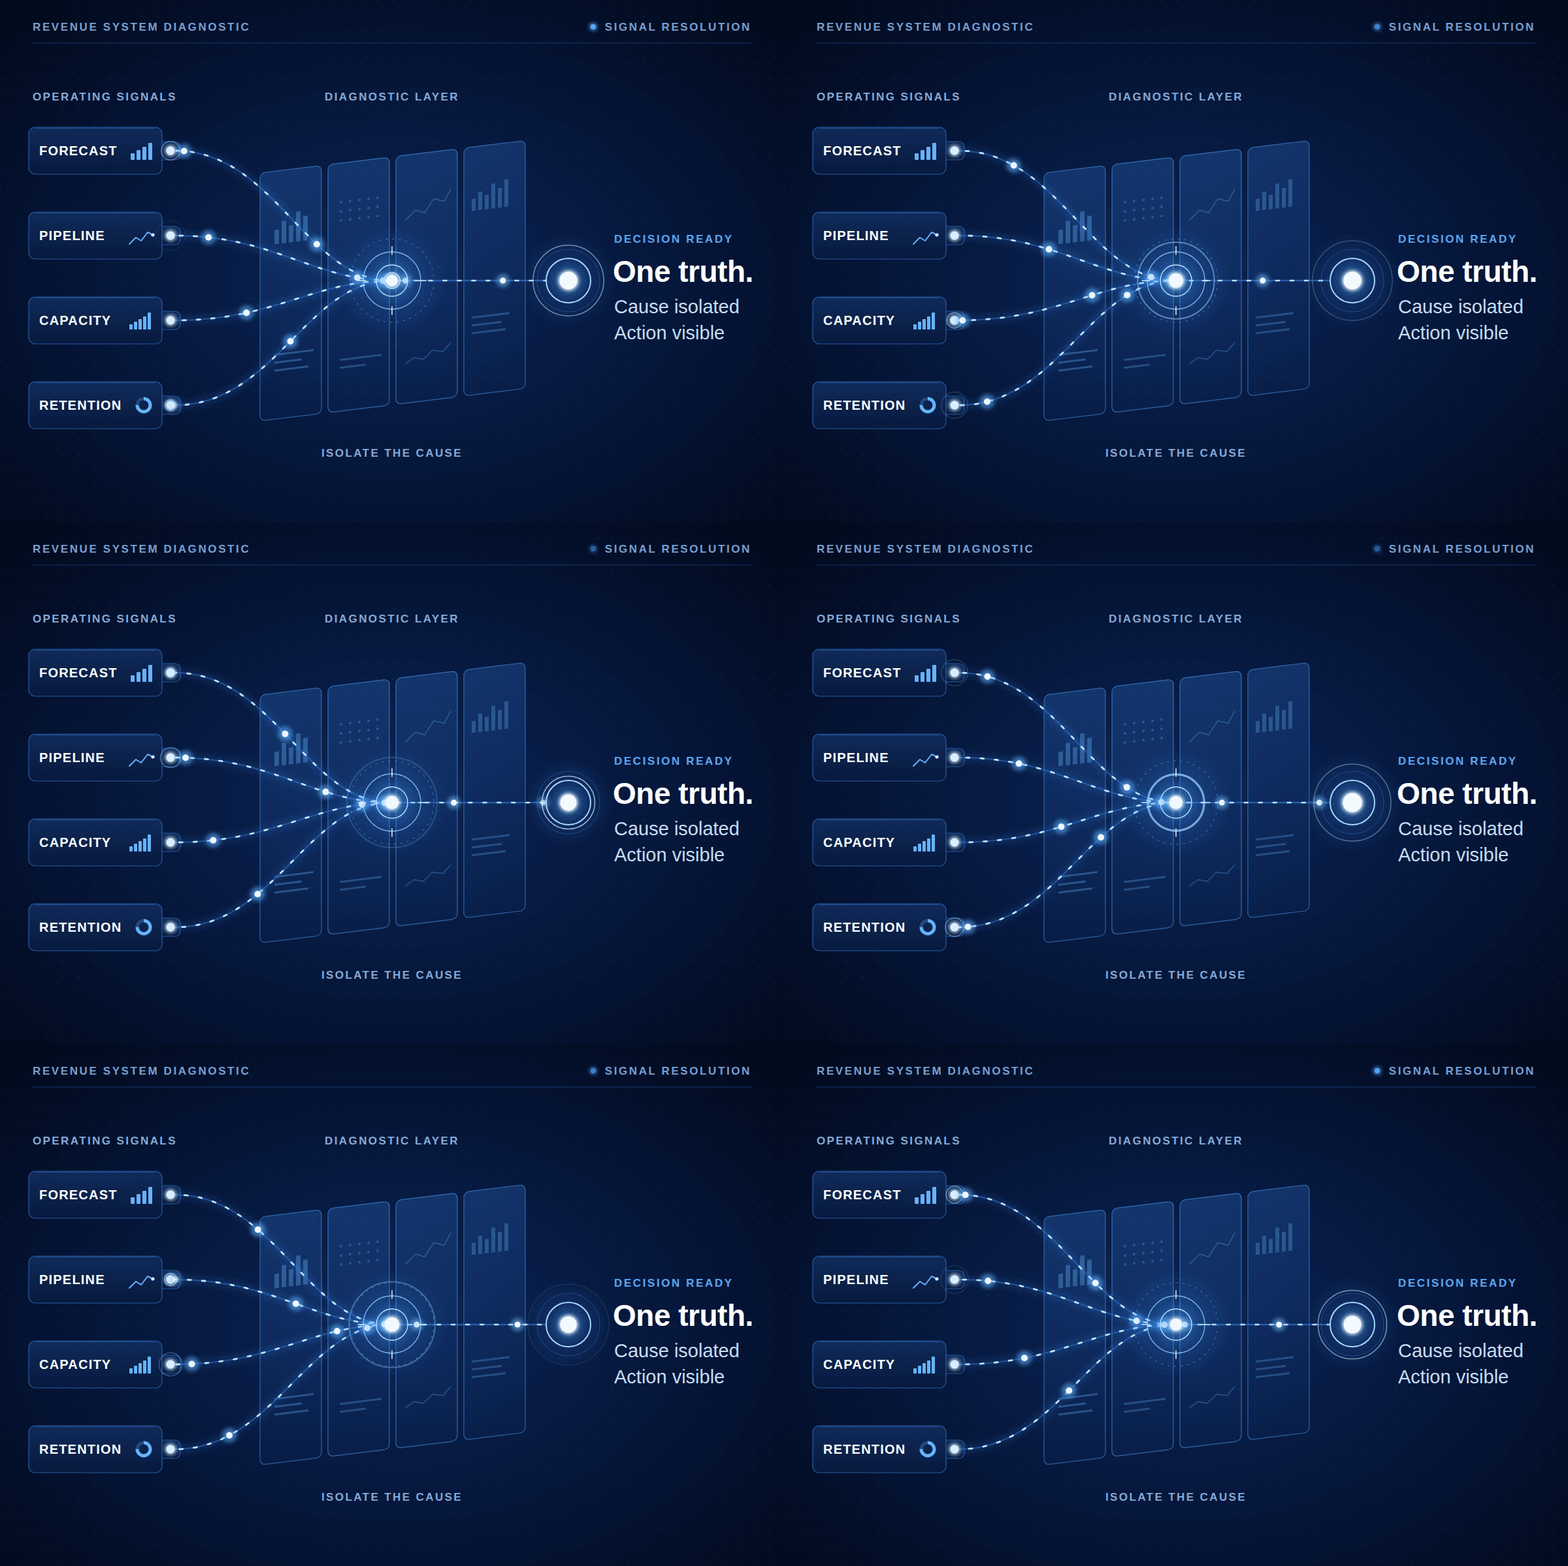
The number is visible. The truth behind it isn’t.
These are not isolated reporting problems. They are signs that the revenue system is producing conflicting signals, or no usable signal at all.
01
The forecast changes depending on who presents it.
02
Pipeline coverage looks healthy, but bookings keep missing.
03
Sales stages measure confidence instead of buyer progress.
04
Territories and targets cannot be defended with data.
05
Renewal risk appears after the account is already in danger.
06
RevOps produces reports, but leadership still lacks a decision.
WHERE THE REVENUE SYSTEM BREAKS
I work backward from the executive decision.
The work starts with the question leadership needs answered, then follows the evidence through the model, process, data, and operating cadence.
01
The forecast cannot be trusted.
Leadership sees a number, but cannot inspect or defend how it was produced.
WHAT I ADDRESS
Forecast logic, pipeline inspection, stage evidence, qualification, and the management cadence surrounding the number.
SELECTED RESULT
90%
Forecast accuracy achieved
02
Pipeline exists, but it is not moving.
Coverage obscures aged, stalled, or low-evidence opportunities.
WHAT I ADDRESS
Deal aging, stage conversion, stalled opportunities, coverage quality, rep behavior, and recoverable revenue.
SELECTED RESULT
$4.33M
Stalled pipeline isolated
03
I can't identify repeatable sales plays.
There is no way to audit all of our calls and conversations to surface trends.
WHAT I ADDRESS
Trend analysis and pattern recognition to surface sales plays, product feedback, and the voice of the customer.
SELECTED RESULT
31,000+
Gong transcripts audited
04
The systems tell different stories.
Sales, Finance, Customer Success, and the CRM each define reality differently.
WHAT I ADDRESS
CRM architecture, lifecycle definitions, ownership, stage design, reporting logic, and the operating process around the system.
SELECTED RESULT
One truth
The systems tell different stories.
05
Customer risk appears too late.
Teams see churn as an event instead of a sequence of signals.
WHAT I ADDRESS
Renewal forecasting, churn indicators, account segmentation, customer health, and retention operating cadence.
SELECTED RESULT
NRR + GRR
Retention performance improved
06
The data contains insight nobody is using.
Signals exist across conversations and systems, but never become visible, actionable intelligence.
WHAT I ADDRESS
Conversation intelligence, Gong analysis, AI-assisted workflows, signal design, and GTM decision support.
SELECTED RESULT
$5.4M
Pipeline surfaced
WHAT THE WORK PRODUCES
Not another recommendation deck. A working revenue system.
A forecast model leadership can inspect and defend
Stages tied to observable buyer evidence
An ICP and territory model connected to capacity
A prioritized view of stalled and recoverable revenue
The work starts with the question leadership needs answered, then follows the evidence through the model, process, data, and operating cadence.
CRM architecture with clear definitions and ownership
Renewal and churn signals that trigger action
Operating rhythms with decisions and consequences
AI workflows attached to a real revenue decision
SELECTED CLIENT EVIDENCE
Proof belongs beside the problem.
Each engagement is different. The standard is the same: isolate what is happening, make the decision visible, and install a way to act on it.
FORECAST RELIABILITY
CONVERSATION INTELLIGENCE
PIPELINE RECOVERY
Rebuilt the logic behind the number, not just the report.
Turned thousands of sales conversations into pipeline signal.
Separated active opportunity from pipeline that required intervention.
Aligned forecast definitions, inspection, and management cadence so leadership could see what changed and why.
Analyzed customer language and selling patterns at scale to identify neglected demand already present in the data.
Made aging and stalled revenue visible so leadership could prioritize recovery, remediation, or removal.
90%
forecast accuracy
$5.4M
pipeline surfaced
$4.33M
stalled pipeline isolated
HOW CLIENTS ENGAGE ME
Start with the problem. Scale the work to what it requires.
Some problems need a bounded diagnostic. Others require a system build or experienced operating ownership. The engagement follows the evidence.
01
02
03
Diagnose
Identify what is actually breaking, what the evidence supports, and what leadership should do next.
Build
Design and implement the model, process, CRM logic, reporting, and operating cadence required to fix it.
Operate
Provide experienced RevOps leadership to run the system, drive accountability, and continuously improve it.
bottom of page